[PYTHON] How to use data analysis tools for beginners
Purpose of this article ・ Target audience
There are many tools for data analysis. Here, data analysis tools include Excel, programming, dashboard tools, BI tools, and so on.
In this article, we will explain what kind of analysis tool should be used in what kind of situation for beginners of data analysis and those who are going to analyze data in the future.
The number one reason why what kind of analysis tool is used in what kind of situation is important is that data analysis can be performed efficiently by using the right tool. Where you don't need programming, you may not have to force it, In some situations, useful BI tools may not be useful and may require programming or SQL knowledge.
Also, those who are going to analyze data will be wondering how much knowledge they should have for the analysis they want (or are entrusted with). At that time, if you somehow know what kind of analysis tool to use in what kind of situation, you can predict how much knowledge you need.
The analysis tools that this article targets and their characteristics
Classification of data analysis
Data analysis can be broadly divided into two types: "** ad hoc analysis **" and "regular analysis".
Companies and research that do not have a well-developed and unautomated data analysis foundation will have to manually analyze the data each time it is needed. This is called ** ad hoc analysis ** in the sense of ad hoc analysis.
** Ad hoc analysis ** uses an interactive analysis tool that allows you to execute queries and data transformation / aggregation processing and check the results immediately.
On the other hand, if you are required to do regular reporting instead of manually analyzing each time, a dashboard tool that automatically aggregates and displays the data to some extent is used.
here, ・ Excel ・ Programming language ・ BI tools ・ Dashboard tool
Let's take a look at each feature and specific product of, and see what kind of tool is used in what kind of situation.
Excel First of all, the Excel teacher that everyone knows! I grew up being educated to analyze data by programming without using Excel, so I'm actually not as good at Excel as Python ...
In fact, Excel is sufficient for simple analysis.
Pivot table
First, let's learn how to use a pivot table. This is because crosstabs with pivot tables are the basis of any data analysis.
-Cross tabulation is the basis of analysis! -How to use the pivot table! Easy cross tabulation in Excel -How to use Excel PivotTable in an easy-to-understand manner and how to simplify cross tabulation
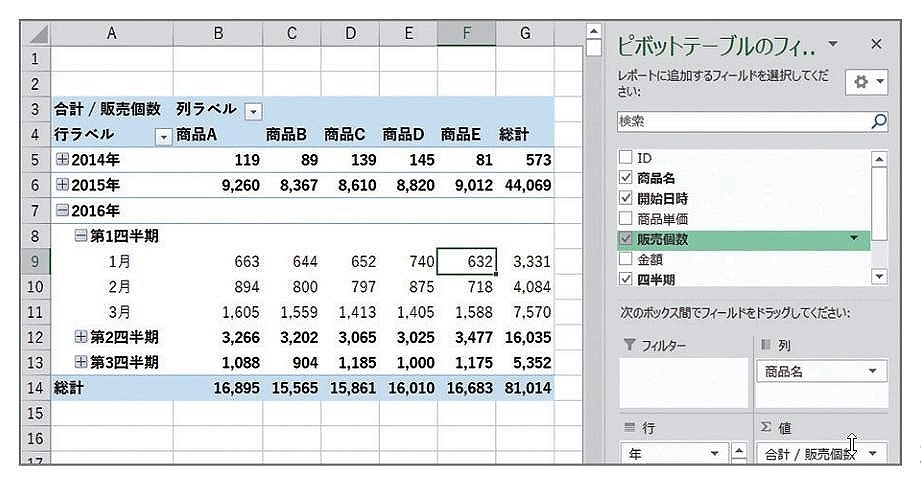
The idea of cross tabulation itself is common to both Excel and programming, so if you don't know this idea, you can't talk about it.
What Excel is not good at
Excel is a very useful tool, but there are limits to data integration. Increasing the number of columns in the horizontal direction is an Excel-like process, but it is not good at integrating data in the vertical direction.
For example, consider the case of handling time series data of a sensor. (In abstraction, Google Analytics is like a sensor, isn't it?)
Assume that sensor ① records data every second, and sensor ② records data every 10 seconds. When aggregating and integrating those data, the data of sensor ① must be averaged every 10 seconds or the representative value must be fetched and combined.
Performing these processes in Excel is a hassle, and when the number of data is hundreds of thousands or millions of rows, the calculation becomes slow in Excel.
Although, For example, Excel will suffice when dealing with management indicators. At best, we only discuss by looking at the aggregated results for each week or month. Therefore, consulting companies and accounting firms still recognize that using Excel is one of the important skills.
Programming language (Python)
Here, we will take up Python as a programming language. It is no exaggeration to say that Python has dominated the world as a programming language for data analysis in recent years, and it has abundant libraries for data analysis, and Jupyter Notebook, an interactive tool described later, is popular.
Jupyter Notebook
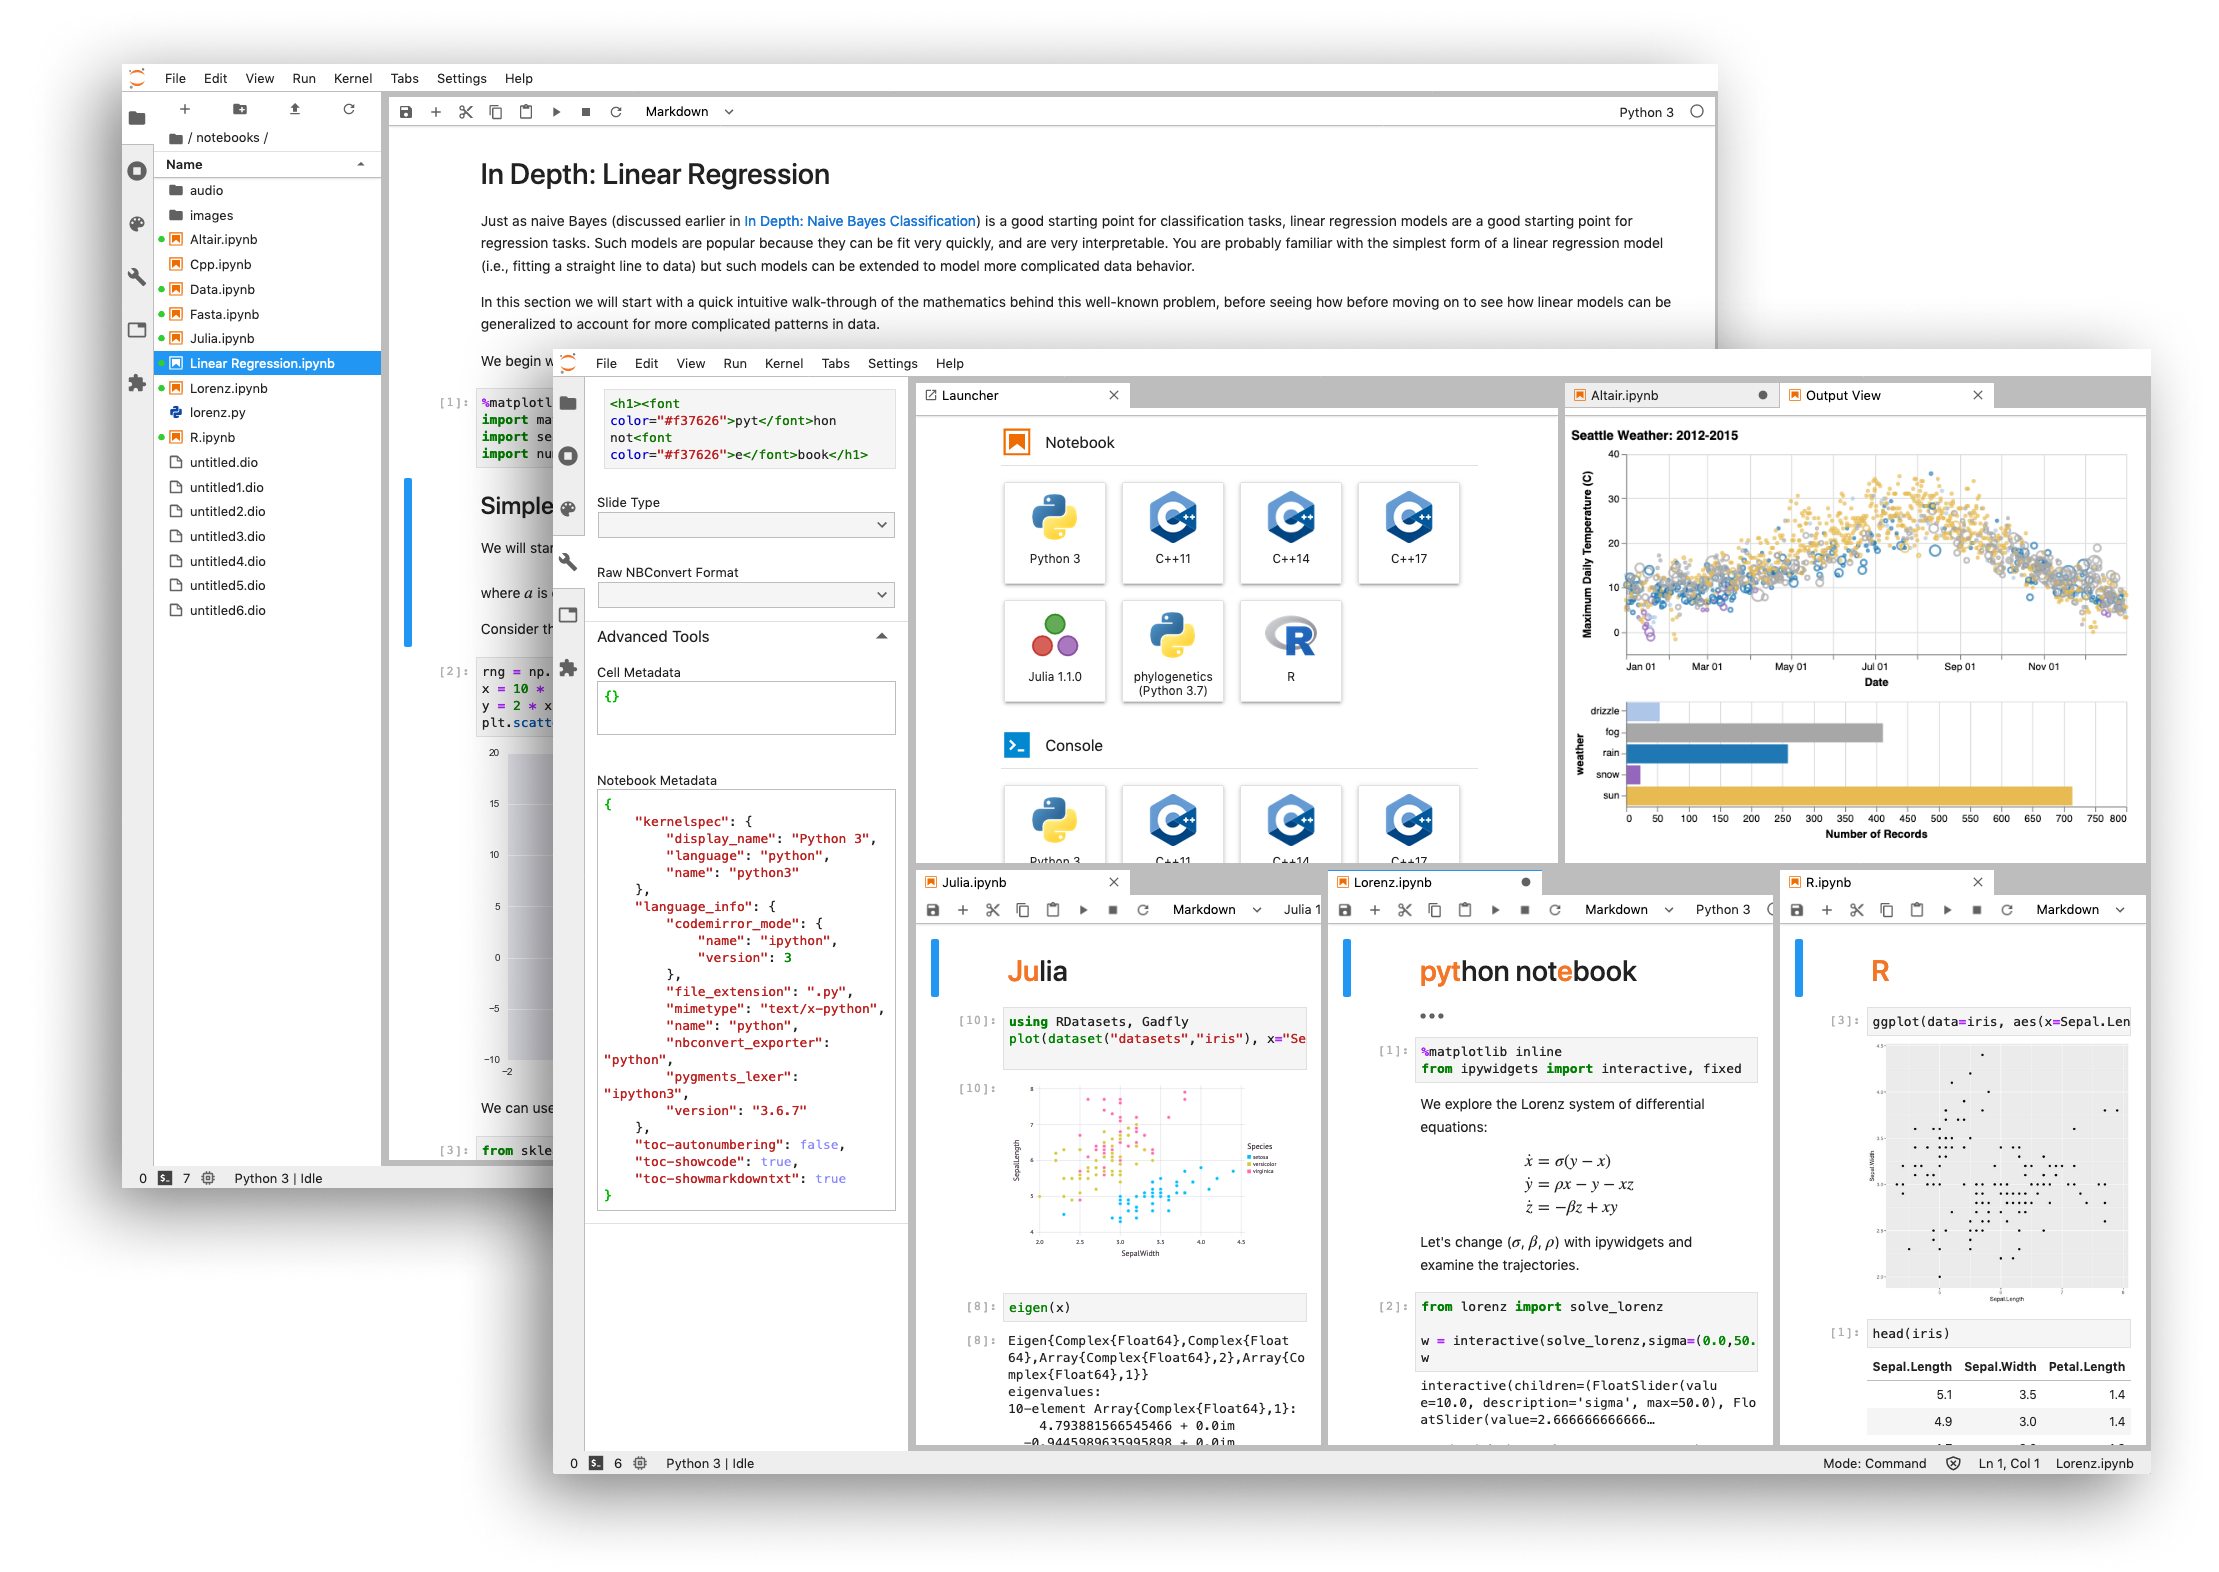 (From Official Homepage)
Jupyter Notebook is an open source interactive script execution tool. In addition to Python, programming languages such as Ruby and R can also be executed.
You can visualize the results for each processing process. You can also write explanations in Markdown format, so it works well as a report to show to others.
The most famous library for creating graphs in Python is the library matplotlib. It is possible to make a fashionable graph like the picture taken from the above official homepage.
The following books will be helpful for data analysis and visualization using Python.
-[IPython Data Science Cookbook 2nd Edition](https://www.amazon.co.jp/IPython%E3%83%87%E3%83%BC%E3%82%BF%E3%82%B5% E3% 82% A4% E3% 82% A8% E3% 83% B3% E3% 82% B9% E3% 82% AF% E3% 83% 83% E3% 82% AF% E3% 83% 96% E3% 83% 83% E3% 82% AF-% E7% AC% AC2% E7% 89% 88-% E2% 80% 95% E5% AF% BE% E8% A9% B1% E5% 9E% 8B% E3% 82% B3% E3% 83% B3% E3% 83% 94% E3% 83% A5% E3% 83% BC% E3% 83% 86% E3% 82% A3% E3% 83% B3% E3% 82% B0% E3% 81% A8% E5% 8F% AF% E8% A6% 96% E5% 8C% 96% E3% 81% AE% E3% 81% 9F% E3% 82% 81% E3% 81% AE% E3% 83% AC% E3% 82% B7% E3% 83% 94% E9% 9B% 86-Cyrille-Rossant / dp / 4873118549 / ref = pd_sbs_14_t_2 / 355-1889098-6063963? _Encoding = UTF8 & pd_rd_i = 4873118549 & pd_rd_r = ff22 69a4-4cb3-b7ef-4b43770ccce2 & pd_rd_w = 721iz & pd_rd_wg = 5k45z & pf_rd_p = ca22fd73-0f1e-4b39-9917-c84a20b3f3a8 & pf_rd_r = 6E4TX40027T4BEWS7G3B & psc = 1 & pf_rd_r = 6E4TX40027T4BEWS7G3B
Python limits
Of course, mastering Python for data analysis is not easy. For beginners in programming, learning costs are high.
So, in the sense that non-engineers can't analyze the data, it's not really democratized.
BI tools
Therefore, BI tools have become popular as data analysis tools in recent years. You've probably heard the name of the tool Tableau.
In recent years, I hear that consulting companies are increasingly using Tableau for analysis.
When I was working for a consulting company, I felt that Tableau was now, younger, and trendier than Excel.
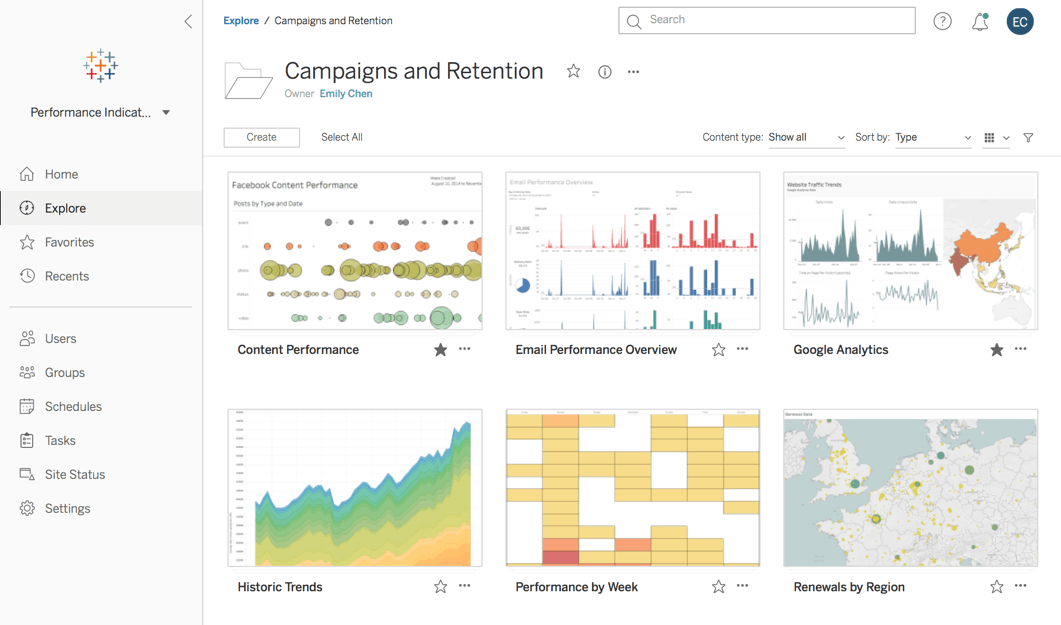
(From Tableau Official Homepage)
It is suitable for team members to proceed with analysis while making graphs. In terms of usage, the dashboard tools described below are aimed at automating analysis, while BI tools are used for more exploratory data analysis.
What BI tools can't do
BI tools are great and very valuable as they help democratize your data.
However, although BI tools can handle integrated data, the integration work itself is not good (it can be done). Before using BI tools, you have to write your own SQL queries for data aggregation and integration.
So, in the end, you need a data preprocessing team that integrates your data and makes it easier for BI tools to read for meaningful analysis.
Dashboard tool
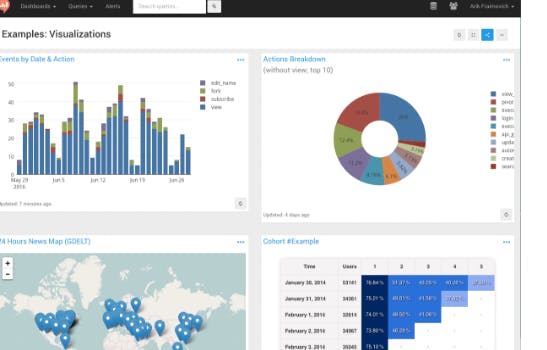
In contrast to ad hoc analysis, dashboard tools are used for the purpose of periodically querying, creating reports, and displaying graphs.
Some of the most famous are Redash.
Until you set up docker-based redash on AWS EC2 from scratch and start it
Dashboard tools are focused on automating the analysis of data so that it can be reviewed on a regular basis.
However, there are many dashboard tools that do not support creating interactive dashboards like BI tools. To the last, it is optimized to visualize the latest information on a regular basis.
Limitations of dashboard tools
In order to use the dashboard, you need to execute a programming language and SQL. (Of course, pretreatment is also required separately.)
In fact, the visualization tools that claim to be able to do advanced things are, in fact, "you can write and execute Python code internally."
The Story of Mercari's Data Science Team and Analytical Ecosystem According to this article
At Mercari, there are many people who can write SQL even in non-analyst positions and do simple analysis by themselves. Recently, there are rumors that even the finance department, accounting department, legal department, and designers are studying. (It's a fact)
And that. Everyone is studying hard because they need to execute SQL to analyze it.
In a normal company, the problem is who writes the SQL.
For companies that have a fixed business improvement flow and have constant indicators to follow, it is a good idea to spend a reasonable amount of money to prepare a data analysis platform and introduce dashboard tools.
However, usually, the indicators and data you want to see change rapidly, so you have to change the SQL.
Summary
Companies that have a solid data analysis infrastructure and can afford to properly aggregate and integrate data should introduce BI tools and visualization tools. If members other than engineers also want to analyze data and utilize it in daily discussions, there is no choice but to introduce BI tools and visualization tools.
However, if you haven't decided on the KPI you want to see, or if you haven't decided on what to consider, it's a good idea to use BI tools to discuss it with everyone.
For companies where the flow of consideration from data analysis has already been standardized, it would be better to use visualization tools to automate the analysis.
If the data analysis infrastructure is not yet in place and you just want to store the data for the time being, use a programming language for ad hoc analysis. A proper ad hoc analysis here will reveal what KPIs are important to the company and what they want to consider using the data. This is a very important procedure.
Even if you suddenly automate the analysis, the analysis may eventually become obsolete. It takes time and money to set up a data analysis platform, so it is definitely not good to start building an analysis platform without thinking deeply.
Finally
I wrote this article as the 24th day article of the Advent Calendar of a study group called StudyCo that I have been doing with my friends for many years. I am.
I would be grateful if you could refer to the other articles I have written so far! -[Knowledge and study methods required for future data analysts](https://qiita.com/ueniki/items/343591634277ad309a57#4-%E3%83%87%E3%83%BC%E3%82% BF% E5% 88% 86% E6% 9E% 90% E3% 81% BE% E3% 81% A7% E8% A6% 8B% E8% B6% 8A% E3% 81% 97% E3% 81% 9F% E3% 83% 97% E3% 83% AD% E3% 83% 80% E3% 82% AF% E3% 83% 88% E9% 96% 8B% E7% 99% BA% E3% 82% 84% E5% AE% 9F% E9% A8% 93% E3% 82% 92% E8% A8% 88% E7% 94% BB% E3% 82% 92% E3% 81% A7% E3% 81% 8D% E3% 82% 8B% E8% A8% AD% E8% A8% 88% E5% 8A% 9B) -Recommended study order for machine learning / deep learning beginners -Study method for beginners to get started with Bayesian statistics
I hope it will be a Christmas present for everyone who is going to work on data analysis from now on!
Holy night is also a night talked about with data! Merry Christmas!
reference
-[Technology that supports big data-The world of automation where data is pulsing every moment](https://www.amazon.co.jp/%E3%83%93%E3%83%83%E3%82%B0%E3 % 83% 87% E3% 83% BC% E3% 82% BF% E3% 82% 92% E6% 94% AF% E3% 81% 88% E3% 82% 8B% E6% 8A% 80% E8% A1 % 93% E2% 80% 95% E5% 88% BB% E3% 80% 85% E3% 81% A8% E3% 83% 87% E3% 83% BC% E3% 82% BF% E3% 81% 8C % E8% 84% 88% E6% 89% 93% E3% 81% A4% E8% 87% AA% E5% 8B% 95% E5% 8C% 96% E3% 81% AE% E4% B8% 96% E7 % 95% 8C-WEB-DB-PRESS-plus / dp / 4774192252 / ref = sr_1_1? adgrpid = 51361540737 & gclid = CjwKCAiAi4fwBRBxEiwAEO8_HmhgZ4KfRVGnJK4nNxLL0xYORvf7n6cem_-8iv1dXwIjDBw0v2grbBoCY5kQAvD_BwE & hvadid = 338518033656 & hvdev = c & hvlocphy = 1009279 & hvnetw = g & hvpos = 1t1 & hvqmt = e & hvrand = 15215333001911833338 & hvtargid = aud-759377471893% 3Akwd-422059869037 & hydadcr = 27265_11561134 & jp-ad-ap = 0 & keywords =% E3% 83% 93% E3% 83% 83% E3% 82% B0% E3% 83% 87% E3% 83% BC% E3% 82% BF% E3% 82% 92% E6% 94% AF% E3% 81% 88% E3% 82% 8B% E6% 8A% 80% E8% A1% 93 & qid = 1577190740 & sr = 8-1)
Recommended Posts